By el gato malo
It’s been a LONG time since the US has tried to deal with high inflation. it’s been so long that many have never even seen it before in their lives.
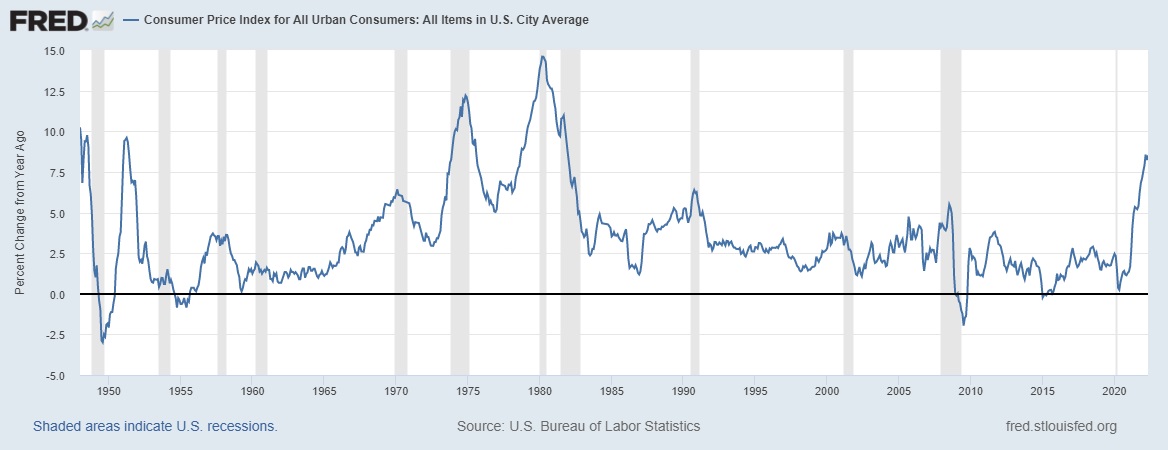
The last time we saw price increases like this was 1982 and the transition to over 8% year on year CPI growth vs the ~2% of the last decade is jarring. People are not used to seeing prices move like this and it makes analysis of what’s going on different and trickier.
I see a lot of people getting tangled up in or misusing basic terms and measures. You could sort of get away with this in low inflation periods, but in periods like this, it leads to huge distortions in perception.
First off, let’s lay out two key concepts: nominal and real.
Nominal is what you mostly think of. It’s salary, the price of a burger, the revenue of a company. If it’s denominated in currency, it’s nominal.
Real means just that: Real. A burger is a burger. If the price of a burger rises from $2 to $3, it’s still the same real value, the same real output. Real is measured in units, not dollars but this confuses people because it still gets reported in dollars (called real, constant, or indexed), generally using a deflator (like CPI (BLS) or GDP-d (BEA)).
To think of this most simply imagine a factory that makes sneakers.
It makes 100 pairs and sells them for $50 each. Nominal output is $5,000. Because it is our reference period, so is real output.
A year later, it makes 100 pairs and sells them for $75 each. Nominal output is $7,500 but real output remains at $5,000 ($7500 nominal / (75/50) price change). This makes intuitive sense: price rose, so dollars collected rose, but units remained the same.
Meanwhile, let’s say you used to get paid $20/hr. So you could buy a pair of sneakers for 2.5 hours of labor. Now you get paid $25/hr. Your nominal earnings are up 25%. This sounds great until you realize that the price of sneakers rose 50% and so it now takes 3 hours of labor to buy them.
Your nominal income rose, but your real income dropped.
And this is where the potential to play games with reporting and mislead people emerges, because we tend to think in nominal terms, but we live and generate welfare in real terms.
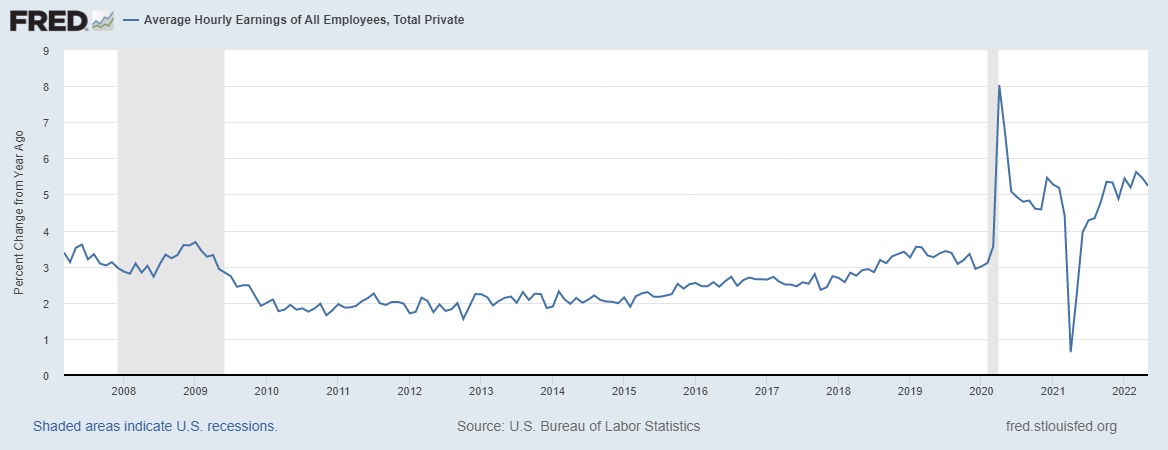
Hourly wages in the US are rising over 5% year on year. Compared to the last 15 years, that’s very high.
This has led some to say things such as:

But this is not really (yes that was deliberate) the case.
5.2% wage growth year on year sounds a lot less fabulous once you see this:

The CPI rose 8.6%, and this, by design, significantly understates the actual change in price level. CPI was changed in the 90’s to be a cost of living index, not a price level measure. So, for example, when it looks at the price to buy a home or to rent an apartment it does not use “market price” as if you were looking to acquire one today. It uses the blend of those buying new or getting new rent and all those already renting and owning and what they pay based on historical leases and mortgages.
This is called “owner equivalent rent.” (OER)
In some ways, this makes sense as it shows what’s actually being spent. But that’s thin comfort if you want to buy a new home or need to renew a lease or move.
In low inflation periods, the variance is less significant. But in high inflation periods, it blows out.
As can be readily seen here, nominal credit card spending (a good proxy for consumer spending) looks robust. It’s easy to mistake that for growth.
But look at real spending. It’s been dropping for a year.

And so have real wages which have been negative for 14 straight months (March 2021 was the last positive reading).

And this is what people feel, because real wages are buying power.
It’s very hard to lie to people about this. They feel it every day and see it in their budgets.
Perversely, telling everyone that the economy is great when it’s not likely makes them feel even worse off. They assume you may be right but see that they are getting worse and so feel like they are falling behind because they presume others must be gaining.
So every time you call a bad economy good, you generate malcontents who feel left out and left behind.
Consumer confidence has never recovered to pre-covid levels. It was coming back, but peaked and reversed in April 2021, declining in May.
It’s not a coincidence that this was 2 months after real wages flipped negative nor somehow aberrant that confidence has fallen to levels similar to the 2008 recession.
Real wages are falling faster than they were then.

Trying to portray this drop in confidence and perception of economic well-being as some kind of smear campaign and psyop is both disingenuous and damaging.
At best, people think you’re a liar or a fool. At worst, they presume you’re telling the truth but that they have been left out of the good times.
This makes people depressed, angry, and erodes confidence further. And this impression can get A LOT worse if you fall into certain subgroups.
Consider:
OER is the biggest component of CPI at ~33% weighting. It’s reporting 5.5% gains from a year ago.
But look at what’s happening to actual market prices for housing. Home prices are up 20.6% year on year. Rent is up 15.4%.

If we blend those 65/35 (to reflect 65% US home ownership rate) we get 18.8% price level change in shelter. That’s more than triple what’s being reported in CPI and this variance of “but i can see the prices and they are up far more than CPI” is why many folks distrust CPI. It’s a somewhat abstruse measure that does not align with market on many items at any given time and if we used housing price level and not OER, 8.6% read would jump massively. 1.8% points of the increase in CPI was shelter. Using market rates, CPI would read 12.9%.
That’s the price hike that new entrants to the market feel today.
Meanwhile, those who bought a house 5 years ago, locked in a low rate, and are seeing huge asset price appreciation are in clover. Their costs are flat and their asset worth more nominally. Their costs are dropping like a rock in real terms, are likely significantly outpaced by wage growth, and they are accumulating capital gains. Their home is getting more affordable measured in hours of labor to pay mortgage and more valuable in hours of labor in value stored in the asset.
It’s a huge win for them.
Inflation is a tax on savers and a subsidy for borrowers.
Those in debt do very well. Those who have lent (including banks who have a notorious temporal mismatch of “lend long term borrow short term” particularly under fractional reserve systems such as ours), do poorly.
If you borrow and buy an inflating asset, you get the double win. You pay back money with less valuable future money and wind up with big asset gains in nominal terms, possibly real terms of the asset outpaces overall inflation as housing has been doing of late (but that housing tends not to in the long run, it tracks overall inflation pretty well).
But if you are trying to buy a new home and your wages rise 5% a year but home prices rise 20%, they move ever further out of reach. It’s obvious you’re falling behind and when you hike mortgage rates, this fall back becomes multiplicative.
Mortgage rates are up from 3 to 5% in the last year. This leads to about a 20% rise in monthly payments on a 30 year fixed loan (including taxes, fees, etc) for any given price and the price rose 20%.
So 1.2 X 1.2 = 1.44 = 44% rise in monthly outlay. The kind of wage increase you need to not lose ground against that is vanishingly rare and we have not yet even spoken of down payments.

If you want to understand why gen Z is furious at the boomers, this is why.
It’s also why the boomers struggle to see how tough times can be if you are not already in on the joke.
This kind of inflation is savage on the young and great if you’re a homeowner.
(Of course, OTOH, all the recent stock market losses are predominantly among the old and the wealthy with $20 trillion having been recently wiped out, so there’s plenty of pain to go around in 401k land and plenty to come as the FED tries to reduce its balance sheet and recession looms.)
But, like so many kinds of economic data, it’s easy to support different views with different looks and like so many economic takes, a lot of people are getting it wrong.
Consider:
This makes it look like homes have been galloping out of reach for 25 years. Clear as the nose on your face, case closed. The boomers and gen X porked the millennials and the Z’s.
WRONG.

They haven’t.
Because mortgage rates plummeted and the price hikes were driven by more leverage.
Actual monthly payments, adjusted for inflation were flat to down from 2000 when QE and ZIRP kicked off.
Through 2016, housing actually got MORE affordable overall (this is probably true through early 2020, I just did not have convenient data).

This is, of course, changing now as rates rise while prices spike. That really is putting the squeeze on the kiddos, but they mostly had a helluva 20 year run to buy, so their widespread perception of having been “pushed out of the American dream by greedy boomers hogging the houses” really doesn’t hold water and choosing to cluster in the 3-5 most expensive real estate markets in America and look down your noses at suburbs is a choice, not a case of “grand theft American dream.”
There’s going to be a lot of acrimony, but a lot of it is ill-founded.
But the bottom line is this:
We’re coming into some hard times, the economy looks to be in for some tough sledding in real terms, and there’s going to be quite a fair bit of pain to go around, some of it the inevitable hangover from a 22 year ZIRP and QE party and some (like energy costs and supply line disruption) self-inflicted by recent policy choices on energy production, transport, sanction, and ill-conceived ESG policy.
No politician likes to take the blame for the economy going bad, especially if their policies have played a major role in derailing a recovery in process.
And so whomever is in power can and will lie to defend such conceits and hobbyhorses. but unlike other fields, it rarely works.
Because everyone is living it.
Simple truth:
If you need to tell people how great the economy is, it’s not great.
It’s easy to use nominal numbers to mislead, but it’s the real numbers that people feel and you cannot hide it. Lying to them about it probably makes matters worse eroding confidence and upping anger.
We’re in for serious times with unserious leadership at Fed, Treasury, Congress, and the White House.
Buckle up.